Market Outlook
November 25, 2016
Market Cues
Domestic Indices
Chg (%)
(Pts)
(Close)
Indian market is expected to open on a positive note tracking the SGX Nifty.
BSE Sensex
(0.7)
(192)
25,860
The US markets were closed for trading on account of the Thanksgiving holiday.
Nifty
(0.8)
(68)
7,966
Mid Cap
(0.1)
(16)
12,026
The FTSE closed slightly higher on light trading volume. Insurer Direct Line Insurance
Group PLC rose 2.8 percent after it was upgraded by Morgan Stanley. Ashtead
Small Cap
(0.1)
(13)
11,792
Group PLC also rose 2.5 percent after its credit rating was upgraded by Moody’s.
Bankex
(1.5)
(309)
20,938
Indian stocks gave some of the gains from the previous sessions on both a weak
rupee as well the expiry of the November derivative contracts. Pharma index
Global Indices
Chg (%)
(Pts)
(Close)
reversed its yesterday’s gains and was down by 1.57 percent. Metal index continued
Dow Jones
0.3
59
19,083
its rally from yesterday and was up by 1.26 percent. Low interest of traders in rolling
Nasdaq
(0.1)
(6)
5,381
over their derivative positions also indicates that interest is likely to remain lower in
FTSE
0.2
11
6,829
view of the greater uncertainty surrounding the effect of demonitisation on
companies and market sentiment.
Nikkei
0.9
170
18,333
Hang Seng
(0.3)
(68)
22,608
News Analysis
Shanghai Com
0.0
1
3,242
US FDA finds violations at Sun Pharma Mohali plant
Aurobindo Pharma searching for more European acquisitions
Advances / Declines
BSE
NSE
Detailed analysis on Pg2
Advances
1,329
846
Investor’s Ready Reckoner
Declines
1,240
745
Key Domestic & Global Indicators
Unchanged
175
74
Stock Watch: Latest investment recommendations on 150+ stocks
Refer Pg5 onwards
Volumes (` Cr)
BSE
2,481
Top Picks
CMP
Target
Upside
NSE
23,742
Company
Sector
Rating
(`)
(`)
(%)
Amara Raja BatteriesAuto & Auto Ancill.
Buy
920
1,167
26.8
Net Inflows (` Cr)
Net
Mtd
Ytd
HCL Tech
IT
Buy
766
1,000
30.5
Asian Granito
Capital Goods
Buy
186
351
89.0
FII
(1,095)
(12,857)
32,157
Equitas Holdings
Financials
Buy
154
235
52.5
MFs
920
8,024
30,077
Navkar Corporation Others
Buy
173
265
53.0
More Top Picks on Pg3
Top Gainers
Price (`)
Chg (%)
Key Upcoming Events
Tataelxsi
1,157
6.2
Previous
Consensus
Date
Region
Event Description
Bergepaint
212
6.2
Reading
Expectations
Hindzinc
274
6.1
Nov 25 UK
GDP (YoY)
2.3
2.3
Nov 29 US
GDP QoQ (Annualised)
2.9
3.0
Il&Fstrans
95
5.5
Nov 29 Euro Zone Euro Zone Consumer Confidence
(6.1)
--
Concor
1,187
5.3
Nov 29 US
Consumer Confidence
98.6
101.2
Nov 30 Germany PMI Manufacturing
54.4
--
Top Losers
Price (`)
Chg (%)
More Events on Pg4
Manappuram
73
(5.5)
Relinfra
452
(5.4)
Jpassociat
7
(4.5)
Den
68
(4.3)
Edelweiss
90
(4.1)
As on November 24, 2016
Market Outlook
November 25, 2016
News Analysis
US FDA finds violations at Sun Pharma Mohali plant
The US drug regulator found seven breaches of manufacturing standards at Sun
Pharmaceutical Industries Ltd’s formulations plant in Mohali, Punjab, following a
recent inspection.
Sun Pharma is struggling to resolve compliance issues at plants acquired from
Ranbaxy as well as its own manufacturing facilities at Halol and Karkhadi.
Regulatory issues, particularly at the Halol unit, have dented the company’s sales
in the US. In 2015-16, US sales were $2.07 billion, down 8% from 2014-15.
Aurobindo Pharma searching for more European acquisitions
Aurobindo Pharma Ltd is searching for more acquisitions in Europe after its
successful turnaround of the money-losing Western European commercial
operations of Irish drug maker Actavis Plc, which was bought for €30 million in
2014. Aurobindo has shareholder approval to raise `2,100cr through a sale of
shares, which it intends to use for acquisitions.
As of the year ending 2015-16, revenue for the company came in at `13,896cr.
Of this Europe contributed about 23% or `3,130cr.
The company is spending about `900cr as capex domestically. This includes an
oral finished dosage facility for European markets in Visakhapatnam, Andhra
Pradesh.
Economic and Political News
Ministry of Civil Aviation grants 'in-principle' approval for setting up of 18
Greenfield Airports
According to the Bank Employees Federation of India (BEFI), the currency note
shortage will continue for another four to five months
National Highways Authority of India (NHAI) estimates a total investment of
`71,911cr for execution of different highway projects during 2016-17
Jan Dhan accounts see a near 50 percent surge in deposits, to `21,000cr
Karnataka Government urges Centre to waive off 50% of farm loans due to
drought
Corporate News
Piramal Fund to lend `360cr for Ozone’s Urbana township project in
Bengaluru
Suven Life Sciences reports 5% YoY increase in profits for Q2FY17
Tata Steel Thyssenkrupp deal to continue in spite of departure of Cyrus Mistry
from Tata Sons
Market Outlook
November 25, 2016
Top Picks ★★★★★
Large Cap
Market Cap
CMP
Target
Upside
Company
Rationale
(` Cr)
(`)
(`)
(%)
To outpace battery industry growth due to better technological
Amara Raja Batteries
15,716
920
1,167
26.8
products leading to market share gains in both the
automotive OEM and replacement segments.
The stock is trading at attractive valuations and is factoring all
HCL Tech
1,08,085
766
1,000
30.5
the bad news.
Back on the growth trend; expect a long term growth of 14%
Infosys
2,14,236
933
1,249
33.9
to be a US$20bn in FY2020.
Source: Company, Angel Research
Mid Cap
Market Cap
CMP
Target
Upside
Company
Rationale
(` Cr)
(`)
(`)
(%)
We expect the company would report strong profitability
Asian Granito
559
186
351
89.0
owing to better product mix, higher B2C sales and
amalgamation synergy.
Among the top 4 players in the consumer durables segment.
Bajaj Electricals
2,169
215
274
27.5
Improved profitability backed by turn around in E&P segment.
Strong order book lends earnings visibility.
Favourable outlook for the AC industry to augur well for
Cooling products business which is out pacing the market
Blue Star
4,436
465
634
36.3
growth. EMPPAC division's profitability to improve once
operating environment turns around.
With a focus on the low and medium income (LMI) consumer
Dewan Housing Finance
7,126
228
350
53.7
segment, the company has increased its presence in tier-II &
III cities where the growth opportunity is immense.
Strong loan growth backed by diversified loan portfolio and
Equitas Holdings
5,166
154
235
52.5
adequate CAR. ROE & ROA likely to remain decent as risk of
dilution remains low. Attractive valuations considering growth.
Economic recovery to have favourable impact on advertising
& circulation revenue growth. Further, the acquisition of a
Jagran Prakashan
5,541
170
225
32.7
radio business (Radio City) would also boost the company's
revenue growth.
Speedier execution and speedier sales, strong revenue visibilty
Mahindra Lifespace
1,450
353
522
47.7
in short-to-long run, attractive valuations
We expect the company to report strong growth on back of
healthy growth in domestic branded sales (owing to
Mirza International
926
77
107
39.0
aggressive ad spend and addition in the number of EBOs &
multi-brand outlets [MBOs]) and healthy export revenues.
Massive capacity expansion along with rail advantage at ICD
Navkar Corporation
2,470
173
265
53.0
as well CFS augurs well for the company.
Strong brands and distribution network would boost growth
Siyaram Silk Mills
1,115
1,189
1,605
35.0
going ahead. Stock currently trades at an inexpensive
valuation.
Market leadership in Hindi news genre and no. 2 viewership
ranking in English news genre, exit from the radio business,
TV Today Network
1,818
305
385
26.3
and anticipated growth in ad spends by corporate to benefit
the stock.
Source: Company, Angel Research
Market Outlook
November 25, 2016
Key Upcoming Events
Global economic events release calendar
Bloomberg Data
Date
Time
Country
Event Description
Unit
Period
Last Reported
Estimated
Nov 25, 2016
3:00 PM UK GDP (YoY)
% Change
3Q P
2.30
2.30
Nov 29, 2016
7:00 PM US GDP Qoq (Annualised)
% Change
3Q S
2.90
3.00
3:30 PM Euro Zone Euro-Zone Consumer Confidence
Value
Nov F
(6.10)
8:30 PM US Consumer Confidence
S.A./ 1985=100 Nov
98.60
101.20
Nov 30, 2016
2:25 PM Germany PMI Manufacturing
Value
Nov F
54.40
Dec 01, 2016
2:25 PM Germany Unemployment change (000's)
Thousands
Nov
(13.00)
7:00 PM US Initial Jobless claims
Thousands
Nov 26
251.00
3:00 PM UK PMI Manufacturing
Value
Nov
54.30
6:30 AM China PMI Manufacturing
Value
Nov
51.20
51.00
Dec 02, 2016
7:00 PM US Change in Nonfarm payrolls
Thousands
Nov
161.00
180.00
7:00 PM US Unnemployment rate
%
Nov
4.90
4.90
Dec 05, 2016
2:25 PM Germany PMI Services
Value
Nov F
55.00
Dec 06, 2016
3:30 PM Euro Zone Euro-Zone GDP s.a. (QoQ)
% Change
3Q F
0.30
Dec 07, 2016
3:00 PM UK Industrial Production (YoY)
% Change
Oct
0.30
2:30 PM India RBI Reverse Repo rate
%
Dec 7
5.75
2:30 PM India RBI Repo rate
%
Dec 7
6.25
China Exports YoY%
% Change
Nov
(7.30)
Dec 08, 2016
2:30 PM India RBI Cash Reserve ratio
%
Dec 7
4.00
6:15 PM Euro Zone ECB announces interest rates
%
Dec 8
-
Dec 09, 2016
India Imports YoY%
% Change
Nov
8.10
India Exports YoY%
% Change
Nov
9.59
7:00 AM China Consumer Price Index (YoY)
% Change
Nov
2.10
Dec 12, 2016
5:30 PM India Industrial Production YoY
% Change
Oct
0.70
Dec 13, 2016
3:00 PM UK CPI (YoY)
% Change
Nov
0.90
Source: Bloomberg, Angel Research
Market Outlook
November 25, 2016
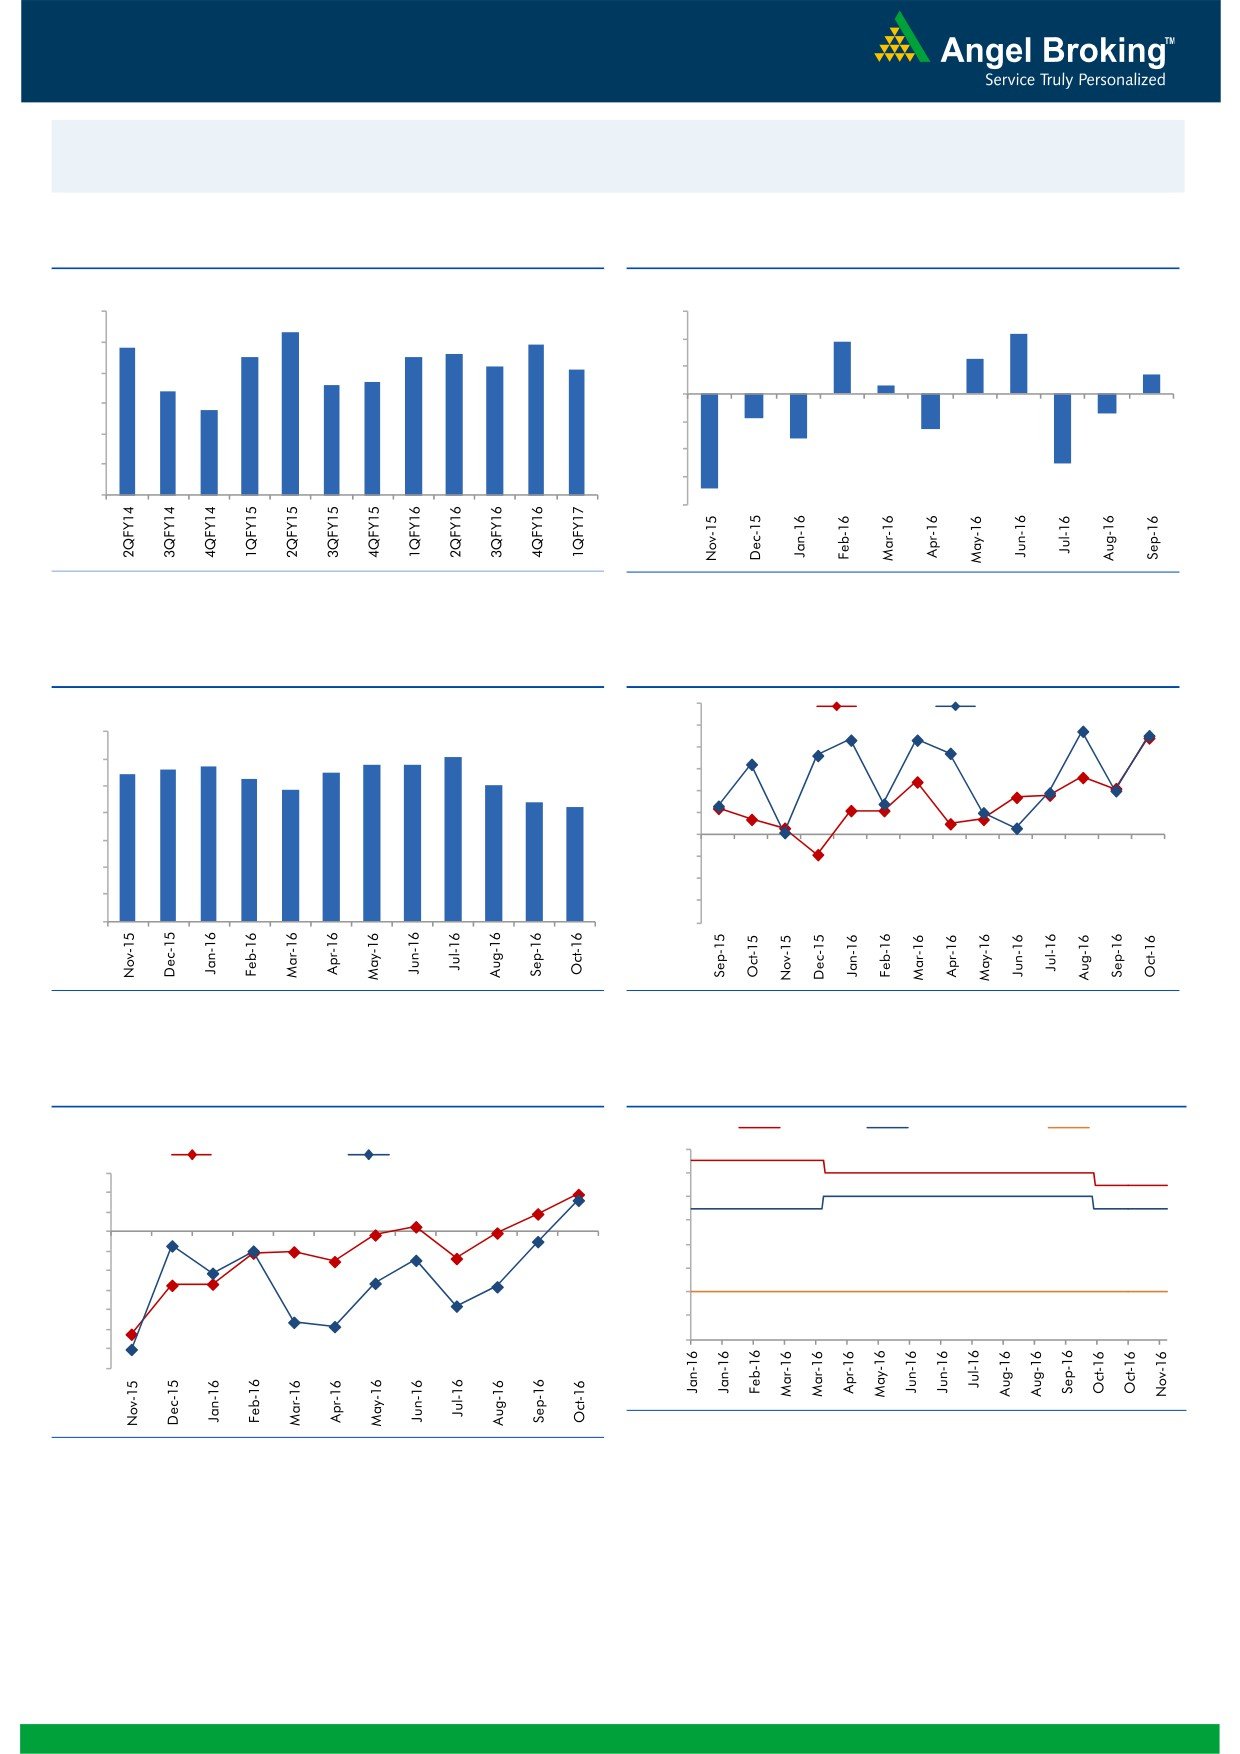
Macro watch
Exhibit 1: Quarterly GDP trends
Exhibit 2: IIP trends
(%)
(%)
9.0
3.0
8.3
2.2
7.9
1.9
7.8
8.0
7.5
7.5
7.6
2.0
1.3
7.2
7.1
0.7
6.6
6.7
1.0
0.3
7.0
6.4
5.8
-
6.0
(1.0)
5.0
(0.7)
(0.9)
(2.0)
(1.3)
(1.6)
4.0
(3.0)
(2.5)
3.0
(4.0)
(3.4)
Source: CSO, Angel Research
Source: MOSPI, Angel Research
Exhibit 3: Monthly CPI inflation trends
Exhibit 4: Manufacturing and services PMI
56.0
Mfg. PMI
Services PMI
(%)
55.0
7.0
6.1
5.7
5.8
5.8
54.0
6.0
5.4
5.6
5.5
5.3
5.1
53.0
4.8
5.0
4.4
4.2
52.0
4.0
51.0
3.0
50.0
49.0
2.0
48.0
1.0
47.0
-
46.0
Source: MOSPI, Angel Research
Source: Market, Angel Research; Note: Level above 50 indicates expansion
Exhibit 5: Exports and imports growth trends
Exhibit 6: Key policy rates
c
(%)
Repo rate
Reverse Repo rate
CRR
7.00
(%)
Exports yoy growth
Imports yoy growth
15.0
6.50
10.0
6.00
5.0
5.50
0.0
5.00
(5.0)
(10.0)
4.50
(15.0)
4.00
(20.0)
3.50
(25.0)
3.00
(30.0)
(35.0)
Source: RBI, Angel Research
Source: Bloomberg, Angel Research
Market Outlook
November 25, 2016
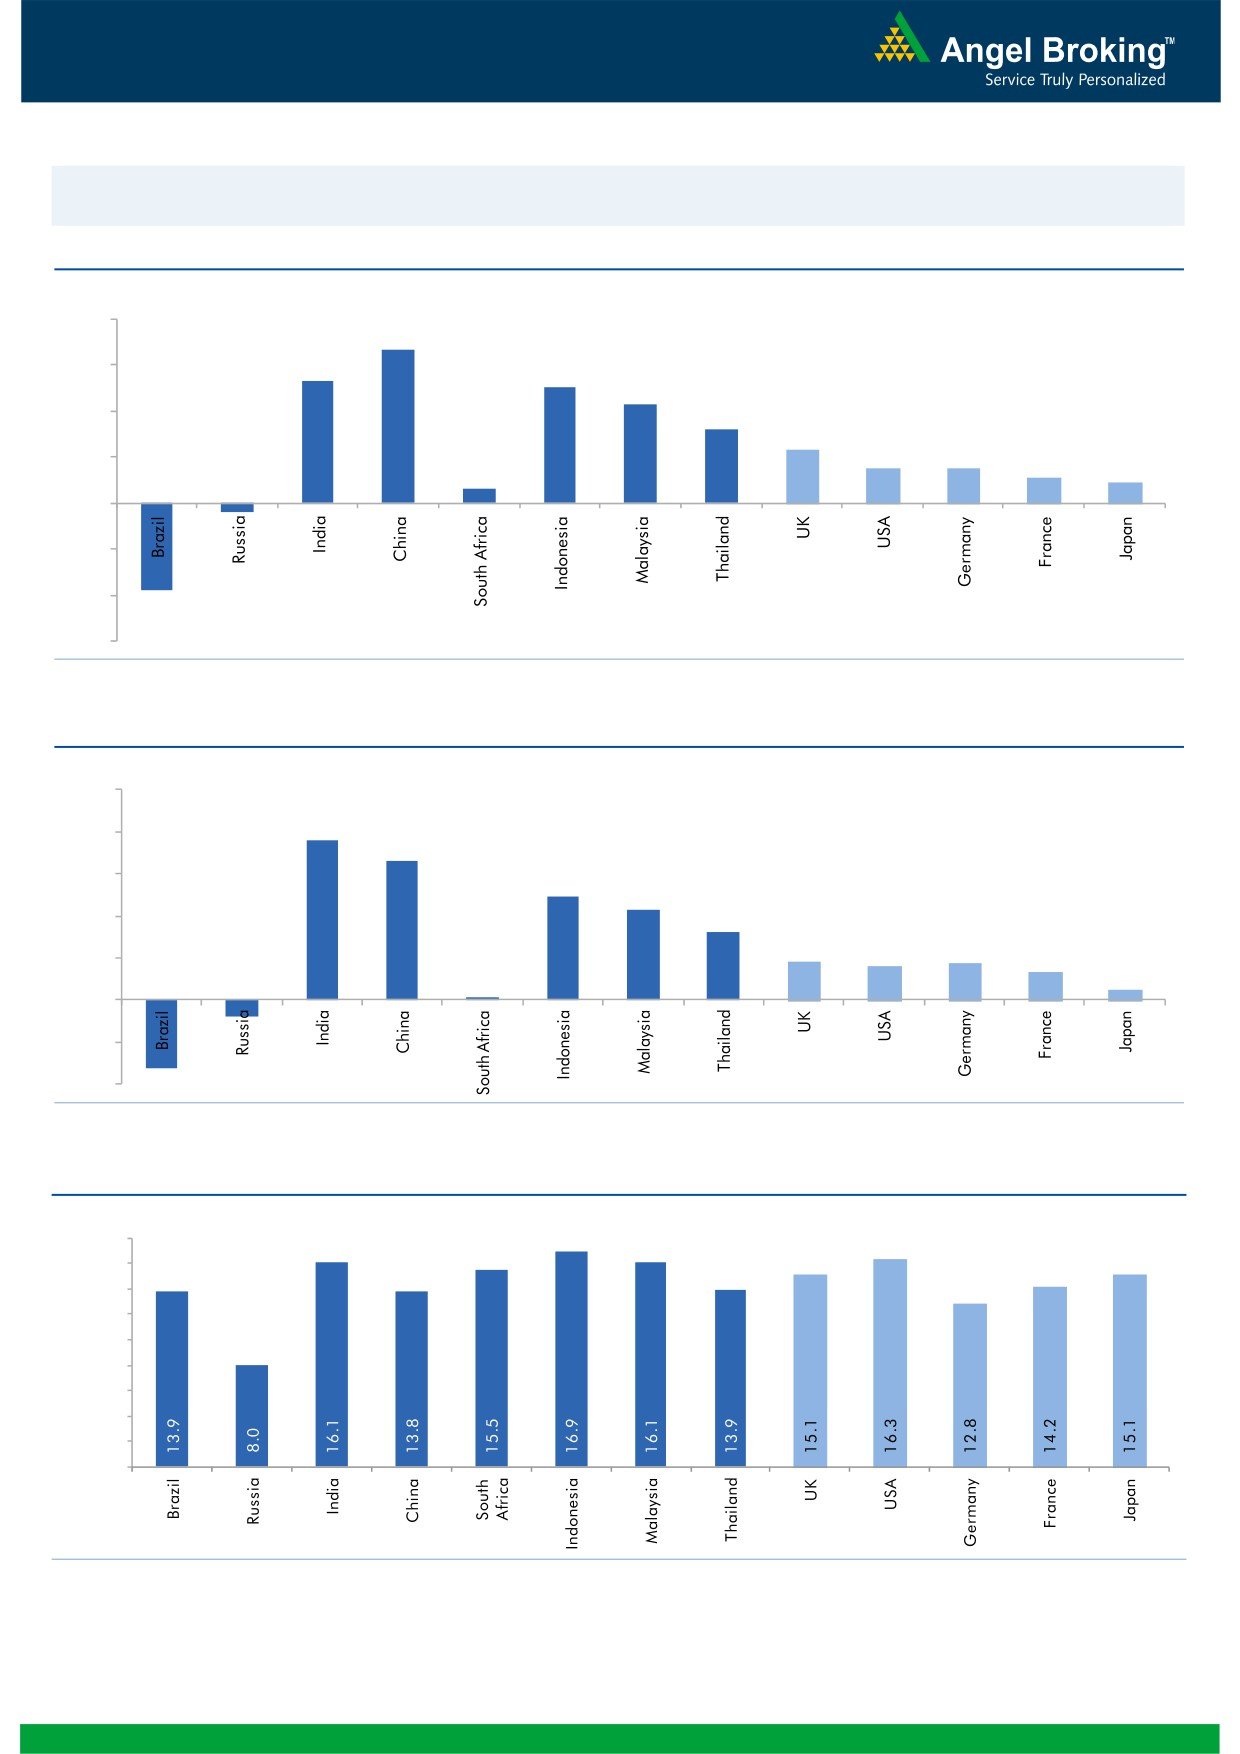
Global watch
Exhibit 1: Latest quarterly GDP Growth (%, yoy) across select developing and developed countries
(%)
8.0
6.7
6.0
5.3
0.6
5.0
4.3
4.0
3.2
2.3
1.5
1.5
2.0
1.1
0.9
-
(2.0)
(0.4)
(4.0)
(3.8)
(6.0)
Source: Bloomberg, Angel Research
Exhibit 2: 2016 GDP Growth projection by IMF (%, yoy) across select developing and developed countries
(%)
10.0
7.6
8.0
6.6
6.0
4.9
4.3
4.0
3.2
1.8
1.7
1.6
1.3
2.0
(0.8)
0.5
(3.3)
0.1
-
(2.0)
(4.0)
Source: IMF, Angel Research
Exhibit 3: One year forward P-E ratio across select developing and developed countries
(x)
18.0
16.0
14.0
12.0
10.0
8.0
6.0
4.0
2.0
-
Source: IMF, Angel Research
Market Outlook
November 25, 2016
Exhibit 4: Relative performance of indices across globe
Returns (%)
Country
Name of index
Closing price
1M
3M
1YR
Brazil
Bovespa
61,396
(4.2)
6.3
29.4
Russia
Micex
2,103
7.1
5.9
16.2
India
Nifty
7,966
(8.5)
(8.1)
1.6
China
Shanghai Composite
3,242
4.1
4.5
(10.0)
South Africa
Top 40
44,082
(2.5)
(5.8)
(5.3)
Mexico
Mexbol
45,266
(6.5)
(5.0)
2.0
Indonesia
LQ45
851
(7.9)
(9.5)
12.6
Malaysia
KLCI
1,624
(3.2)
(4.0)
(1.9)
Thailand
SET 50
928
(2.2)
(5.6)
4.5
USA
Dow Jones
19,083
4.7
3.3
7.1
UK
FTSE
6,829
(2.7)
0.2
7.1
Japan
Nikkei
18,333
6.7
10.8
(6.4)
Germany
DAX
10,689
(0.6)
1.5
(5.4)
France
CAC
4,543
0.0
2.3
(4.0)
Source: Bloomberg, Angel Research
Stock Watch
November 25, 2016
Company Name
Reco
CMP
Target
Mkt Cap
Sales ( Čcr )
OPM(%)
EPS (Č)
PER(x)
P/BV(x)
RoE(%)
EV/Sales(x)
(Č)
Price ( Č)
( Č cr )
FY17E FY18E
FY17E
FY18E
FY17E
FY18E
FY17E
FY18E
FY17E
FY18E
FY17E
FY18E
FY17E
FY18E
Agri / Agri Chemical
Rallis
Accumulate
195
209
3,791
1,937
2,164
13.3
14.3
9.0
11.0
21.7
17.7
3.8
3.3
18.4
19.8
2.0
1.8
United Phosphorus
Accumulate
609
684
30,884
15,176
17,604
18.5
18.5
37.4
44.6
16.3
13.7
3.2
2.6
21.4
21.2
2.1
1.8
Auto & Auto Ancillary
Ashok Leyland
Buy
76
111
21,586
22,407
26,022
10.6
10.6
5.2
6.4
14.5
11.8
3.3
2.8
23.6
24.7
1.0
0.9
Bajaj Auto
Neutral
2,632
-
76,170
25,093
27,891
19.5
19.2
143.9
162.5
18.3
16.2
5.1
4.4
30.3
29.4
2.8
2.4
Bharat Forge
Neutral
911
-
21,201
7,726
8,713
20.5
21.2
35.3
42.7
25.8
21.3
4.8
4.3
18.9
20.1
2.8
2.4
Eicher Motors
Neutral
20,357
-
55,291
16,583
20,447
17.5
18.0
598.0
745.2
34.0
27.3
11.6
8.9
41.2
38.3
3.2
2.5
Gabriel India
Buy
111
130
1,597
1,544
1,715
9.0
9.3
5.4
6.3
20.6
17.7
3.9
3.4
18.9
19.5
1.0
0.9
Hero Motocorp
Buy
3,050
3,541
60,897
30,958
34,139
15.7
15.7
193.6
208.3
15.8
14.6
6.2
5.1
34.2
30.5
1.8
1.6
Jamna Auto Industries Neutral
177
-
1,415
1,486
1,620
9.8
9.9
15.0
17.2
11.8
10.3
2.6
2.2
21.8
21.3
1.0
0.9
L G Balakrishnan & Bros Neutral
590
-
926
1,302
1,432
11.6
11.9
43.7
53.0
13.5
11.1
1.9
1.7
13.8
14.2
0.8
0.7
Mahindra and Mahindra Neutral
1,165
-
72,326
46,534
53,077
11.6
11.7
67.3
78.1
17.3
14.9
2.8
2.5
15.4
15.8
1.5
1.3
Maruti
Buy
4,839
6,006
146,163
68,057
82,958
15.8
15.5
212.1
261.2
22.8
18.5
4.5
3.8
19.8
20.3
1.8
1.4
Minda Industries
Neutral
300
-
2,382
2,728
3,042
9.0
9.1
68.2
86.2
4.4
3.5
1.0
0.8
23.8
24.3
0.9
0.8
Motherson Sumi
Neutral
297
-
41,611
45,896
53,687
7.8
8.3
13.0
16.1
22.7
18.4
7.3
5.8
34.7
35.4
1.0
0.8
Rane Brake Lining
Neutral
994
-
787
511
562
11.3
11.5
28.1
30.9
35.4
32.2
5.4
4.9
15.3
15.0
1.7
1.5
Setco Automotive
Neutral
37
-
499
741
837
13.0
13.0
15.2
17.0
2.5
2.2
0.4
0.4
15.8
16.3
1.1
1.0
Tata Motors
Neutral
453
-
130,805
300,209
338,549
8.9
8.4
42.7
54.3
10.6
8.4
1.7
1.4
15.6
17.2
0.6
0.5
TVS Motor
Neutral
359
-
17,065
13,390
15,948
6.9
7.1
12.8
16.5
28.2
21.7
7.0
5.5
26.3
27.2
1.3
1.1
Amara Raja Batteries
Buy
920
1,167
15,716
5,504
6,605
18.4
19.8
33.4
40.9
27.6
22.5
6.1
4.9
22.1
22.0
2.8
2.4
Exide Industries
Neutral
171
-
14,552
7,439
8,307
15.0
15.0
8.1
9.3
21.1
18.4
3.0
2.6
14.3
16.7
1.6
1.4
Apollo Tyres
Buy
178
235
9,058
12,877
14,504
14.3
13.9
21.4
23.0
8.3
7.7
1.3
1.1
16.4
15.2
0.9
0.8
Ceat
Buy
1,152
1,450
4,659
7,524
8,624
13.0
12.7
131.1
144.3
8.8
8.0
1.6
1.4
19.8
18.6
0.7
0.6
JK Tyres
Neutral
113
-
2,558
7,455
8,056
15.0
15.0
21.8
24.5
5.2
4.6
1.1
0.9
22.8
21.3
0.5
0.4
Swaraj Engines
Neutral
1,328
-
1,649
660
810
15.2
16.4
54.5
72.8
24.4
18.2
7.6
6.9
31.5
39.2
2.3
1.9
Subros
Neutral
162
-
972
1,488
1,681
11.7
11.9
6.4
7.2
25.3
22.6
2.7
2.4
10.8
11.4
0.9
0.8
Indag Rubber
Neutral
175
-
459
286
326
19.8
16.8
11.7
13.3
15.0
13.1
2.5
2.4
17.8
17.1
1.3
1.1
Capital Goods
ACE
Neutral
46
-
452
709
814
4.1
4.6
1.4
2.1
32.6
21.7
1.3
1.3
4.4
6.0
0.8
0.7
BEML
Neutral
788
-
3,280
3,451
4,055
6.3
9.2
31.4
57.9
25.1
13.6
1.5
1.4
6.3
10.9
1.1
0.9
Bharat Electronics
Accumulate
1,299
1,414
29,004
8,137
9,169
16.8
17.2
58.7
62.5
22.1
20.8
3.4
3.1
44.6
46.3
2.5
2.3
Stock Watch
November 25, 2016
Company Name
Reco
CMP
Target
Mkt Cap
Sales ( Čcr )
OPM(%)
EPS (Č)
PER(x)
P/BV(x)
RoE(%)
EV/Sales(x)
(Č)
Price ( Č)
( Č cr )
FY17E
FY18E
FY17E
FY18E
FY17E
FY18E
FY17E
FY18E
FY17E
FY18E
FY17E
FY18E
FY17E
FY18E
Capital Goods
Voltas
Buy
299
407
9,897
6,511
7,514
7.9
8.7
12.9
16.3
23.2
18.4
4.2
3.7
16.7
18.5
1.3
1.1
BGR Energy
Neutral
107
-
770
16,567
33,848
6.0
5.6
7.8
5.9
13.7
18.1
0.8
0.8
4.7
4.2
0.1
0.1
BHEL
Neutral
124
-
30,448
28,797
34,742
-
2.8
2.3
6.9
54.1
18.0
0.9
0.9
1.3
4.8
0.7
0.5
Blue Star
Buy
465
634
4,436
4,283
5,077
5.9
7.3
14.9
22.1
31.3
21.0
6.1
5.1
20.4
26.4
1.1
0.9
Crompton Greaves
Neutral
75
-
4,679
5,777
6,120
5.9
7.0
3.3
4.5
22.6
16.6
1.0
1.0
4.4
5.9
0.8
0.6
Greaves Cotton
Neutral
123
-
3,006
1,755
1,881
16.8
16.9
7.8
8.5
15.8
14.5
3.2
2.9
20.6
20.9
1.4
1.3
Inox Wind
Neutral
176
-
3,905
5,605
6,267
15.7
16.4
24.8
30.0
7.1
5.9
2.0
1.5
25.9
24.4
0.7
0.6
KEC International
Neutral
135
-
3,471
9,294
10,186
7.9
8.1
9.9
11.9
13.6
11.3
2.0
1.7
15.6
16.3
0.6
0.6
Thermax
Neutral
821
-
9,780
5,421
5,940
7.3
7.3
25.7
30.2
31.9
27.2
3.9
3.5
12.2
13.1
1.7
1.5
VATech Wabag
Buy
495
681
2,700
3,136
3,845
8.9
9.1
26.0
35.9
19.1
13.8
2.4
2.0
13.4
15.9
0.8
0.6
Cement
ACC
Neutral
1,324
-
24,860
11,225
13,172
13.2
16.9
44.5
75.5
29.8
17.5
2.8
2.6
11.2
14.2
2.2
1.9
Ambuja Cements
Neutral
201
-
39,921
9,350
10,979
18.2
22.5
5.8
9.5
34.7
21.2
2.9
2.6
10.2
12.5
4.3
3.6
India Cements
Neutral
114
-
3,510
4,364
4,997
18.5
19.2
7.9
11.3
14.5
10.1
1.0
1.0
8.0
8.5
1.6
1.4
JK Cement
Neutral
664
-
4,640
4,398
5,173
15.5
17.5
31.2
55.5
21.3
12.0
2.6
2.2
12.0
15.5
1.6
1.3
J K Lakshmi Cement
Buy
364
565
4,282
2,913
3,412
14.5
19.5
7.5
22.5
48.5
16.2
3.0
2.5
12.5
18.0
2.1
1.7
Orient Cement
Buy
134
215
2,736
2,114
2,558
18.5
20.5
8.1
11.3
16.5
11.8
2.4
2.1
9.0
14.0
1.9
1.5
UltraTech Cement
Neutral
3,482
-
95,569
25,768
30,385
21.0
23.5
111.0
160.0
31.4
21.8
4.0
3.5
13.5
15.8
3.8
3.2
Construction
ITNL
Neutral
95
-
3,137
8,946
10,017
31.0
31.6
8.1
9.1
11.8
10.5
0.4
0.4
4.2
5.0
3.7
3.4
KNR Constructions
Accumulate
705
802
1,982
1,385
1,673
14.7
14.0
41.2
48.5
17.1
14.5
3.2
2.8
14.9
15.2
1.5
1.2
Larsen & Toubro
Buy
1,353
1,700
126,059
67,665
77,249
10.7
11.5
57.3
71.2
23.6
19.0
2.2
2.0
12.6
14.3
2.0
1.8
Gujarat Pipavav Port
Neutral
143
-
6,901
705
788
52.2
51.7
5.0
5.6
28.6
25.5
2.8
2.5
11.2
11.2
9.4
8.0
Nagarjuna Const.
Neutral
73
-
4,069
8,842
9,775
9.1
8.8
5.3
6.4
13.8
11.4
1.1
1.0
8.2
9.1
0.6
0.5
PNC Infratech
Buy
113
143
2,892
2,350
2,904
13.1
13.2
9.0
8.8
12.5
12.8
0.5
0.4
15.9
13.9
1.3
1.1
Simplex Infra
Neutral
291
-
1,440
6,829
7,954
10.5
10.5
31.4
37.4
9.3
7.8
1.0
0.9
9.9
13.4
0.6
0.5
Power Mech Projects
Neutral
446
-
656
1,801
2,219
12.7
14.6
72.1
113.9
6.2
3.9
1.1
1.0
16.8
11.9
0.4
0.3
Sadbhav Engineering
Accumulate
275
298
4,718
3,598
4,140
10.3
10.6
9.0
11.9
30.6
23.1
3.2
2.8
9.9
11.9
1.6
1.4
NBCC
Neutral
225
-
13,524
7,428
9,549
7.9
8.6
8.2
11.0
27.5
20.5
1.4
1.1
28.2
28.7
1.5
1.1
MEP Infra
Neutral
35
-
574
1,877
1,943
30.6
29.8
3.0
4.2
11.8
8.4
5.7
3.8
0.6
0.6
1.7
1.5
SIPL
Neutral
84
-
2,966
1,036
1,252
65.5
66.2
(8.4)
(5.6)
3.2
3.6
(22.8)
(15.9)
11.1
9.2
Stock Watch
November 25, 2016
Company Name
Reco
CMP
Target
Mkt Cap
Sales ( Čcr )
OPM(%)
EPS (Č)
PER(x)
P/BV(x)
RoE(%)
EV/Sales(x)
(Č)
Price ( Č)
( Č cr )
FY17E
FY18E
FY17E
FY18E
FY17E
FY18E
FY17E
FY18E
FY17E
FY18E
FY17E
FY18E
FY17E
FY18E
Construction
Engineers India
Neutral
277
-
9,345
1,725
1,935
16.0
19.1
11.4
13.9
24.3
20.0
3.4
3.3
13.4
15.3
4.3
3.9
Financials
Axis Bank
Buy
468
630
111,700
46,932
53,575
3.5
3.4
32.4
44.6
14.5
10.5
1.9
1.6
13.6
16.5
-
-
Bank of Baroda
Neutral
167
-
38,537
19,980
23,178
1.8
1.8
11.5
17.3
14.5
9.7
1.7
1.4
8.3
10.1
-
-
Canara Bank
Neutral
306
-
16,610
15,225
16,836
1.8
1.8
14.5
28.0
21.1
10.9
1.5
1.2
5.8
8.5
-
-
Dewan Housing Finance Buy
228
350
7,126
2,225
2,688
2.9
2.9
29.7
34.6
7.7
6.6
1.2
1.1
16.1
16.8
-
-
Equitas Holdings
Buy
154
235
5,166
939
1,281
11.7
11.5
5.8
8.2
26.6
18.8
2.3
2.0
10.9
11.5
-
-
Federal Bank
Neutral
68
-
11,675
9,353
10,623
2.9
2.9
4.4
5.8
15.4
11.7
1.5
1.3
9.5
11.0
-
-
HDFC
Neutral
1,218
-
192,617
11,475
13,450
3.4
3.4
45.3
52.5
26.9
23.2
5.2
4.6
20.2
20.5
-
-
HDFC Bank
Buy
1,167
1,350
295,429
46,097
55,433
4.5
4.5
58.4
68.0
20.0
17.2
3.5
2.9
18.8
18.6
-
-
ICICI Bank
Buy
260
315
151,094
42,800
44,686
3.1
3.3
18.0
21.9
14.4
11.9
2.0
1.8
11.1
12.3
-
-
LIC Housing Finance
Buy
520
630
26,230
3,712
4,293
2.6
2.5
39.0
46.0
13.3
11.3
2.5
2.1
19.9
20.1
-
-
Punjab Natl.Bank
Neutral
138
-
29,366
23,532
23,595
2.3
2.4
6.8
12.6
20.3
11.0
3.1
2.2
3.3
6.5
-
-
RBL Bank
Neutral
338
-
12,485
1,783
2,309
2.6
2.6
12.7
16.4
26.6
20.6
2.9
2.6
12.8
13.3
-
-
South Ind.Bank
Neutral
21
-
2,768
6,435
7,578
2.5
2.5
2.7
3.1
7.6
6.6
1.0
0.8
10.1
11.2
-
-
St Bk of India
Neutral
262
-
203,152
88,650
98,335
2.6
2.6
13.5
18.8
19.4
13.9
1.8
1.6
7.0
8.5
-
-
Union Bank
Neutral
151
-
10,404
13,450
14,925
2.3
2.3
25.5
34.5
5.9
4.4
0.9
0.7
7.5
10.2
-
-
Yes Bank
Neutral
1,119
-
47,093
8,978
11,281
3.3
3.4
74.0
90.0
15.1
12.4
2.9
2.4
17.0
17.2
-
-
FMCG
Asian Paints
Neutral
938
-
89,944
17,128
18,978
16.8
16.4
19.1
20.7
49.1
45.3
17.1
16.1
34.8
35.5
5.2
4.7
Britannia
Buy
2,939
3,626
35,258
9,594
11,011
14.6
14.9
80.3
94.0
36.6
31.3
15.1
11.6
41.2
-
3.5
3.0
Colgate
Accumulate
934
995
25,395
4,605
5,149
23.4
23.4
23.8
26.9
39.2
34.7
21.7
17.0
64.8
66.8
5.4
4.8
Dabur India
Accumulate
277
304
48,746
8,315
9,405
19.8
20.7
8.1
9.2
34.2
30.1
9.5
7.9
31.6
31.0
5.5
4.8
GlaxoSmith Con*
Neutral
5,084
-
21,382
4,350
4,823
21.2
21.4
179.2
196.5
28.4
25.9
7.5
6.4
27.1
26.8
4.3
3.8
Godrej Consumer
Neutral
1,430
-
48,705
10,235
11,428
18.4
18.6
41.1
44.2
34.8
32.4
7.7
6.5
24.9
24.8
4.8
4.3
HUL
Neutral
827
-
178,962
35,252
38,495
17.8
17.8
20.7
22.4
40.1
36.9
38.3
32.8
95.6
88.9
4.9
4.5
ITC
Buy
224
284
269,903
40,059
44,439
38.3
39.2
9.0
10.1
24.9
22.1
6.9
6.1
27.8
27.5
6.2
5.6
Marico
Buy
251
300
32,435
6,430
7,349
18.8
19.5
6.4
7.7
39.3
32.7
11.9
10.0
33.2
32.5
4.9
4.2
Nestle*
Neutral
6,139
-
59,190
10,073
11,807
20.7
21.5
124.8
154.2
49.2
39.8
20.2
18.2
34.8
36.7
5.7
4.8
Tata Global
Neutral
115
-
7,264
8,675
9,088
9.8
9.8
7.4
8.2
15.6
14.0
1.8
1.7
7.9
8.1
0.8
0.7
Procter & Gamble
Accumulate
6,525
7,369
21,181
2,939
3,342
23.2
23.0
146.2
163.7
44.6
39.9
99.9
95.8
25.3
23.5
6.8
5.9
Hygiene
Stock Watch
November 25, 2016
Company Name
Reco
CMP
Target
Mkt Cap
Sales ( Čcr )
OPM(%)
EPS (Č)
PER(x)
P/BV(x)
RoE(%)
EV/Sales(x)
(Č)
Price ( Č)
( Č cr )
FY17E FY18E
FY17E
FY18E
FY17E
FY18E
FY17E
FY18E
FY17E
FY18E
FY17E
FY18E
FY17E
FY18E
IT
HCL Tech^
Buy
766
1,000
108,085
49,242
57,168
20.5
20.5
55.7
64.1
13.8
12.0
2.8
2.1
20.3
17.9
2.1
1.7
Infosys
Buy
933
1,249
214,236
68,350
77,326
27.0
27.0
62.5
69.4
14.9
13.4
3.2
2.9
21.3
21.6
2.6
2.2
TCS
Buy
2,187
2,620
430,834
119,025
133,308
27.6
27.6
131.2
145.5
16.7
15.0
5.4
5.0
32.4
33.1
3.4
3.0
Tech Mahindra
Buy
460
600
44,613
29,673
32,937
15.5
17.0
32.8
39.9
14.0
11.5
2.8
2.4
19.6
20.7
1.2
1.1
Wipro
Buy
451
590
109,614
55,440
60,430
18.1
18.1
35.9
39.9
12.6
11.3
2.2
2.1
19.0
19.3
1.7
1.6
Media
D B Corp
Neutral
363
-
6,663
2,297
2,590
27.4
28.2
21.0
23.4
17.3
15.5
4.0
3.5
23.7
23.1
2.7
2.3
HT Media
Neutral
71
-
1,660
2,693
2,991
12.6
12.9
7.9
9.0
9.0
7.9
0.8
0.7
7.8
8.3
0.2
0.1
Jagran Prakashan
Buy
170
225
5,541
2,355
2,635
28.0
28.0
10.8
12.5
15.7
13.6
3.4
2.9
21.7
21.7
2.4
2.1
Sun TV Network
Neutral
447
-
17,618
2,850
3,265
70.1
71.0
26.2
30.4
17.1
14.7
4.4
3.9
24.3
25.6
5.8
4.9
Hindustan Media
Neutral
267
-
1,957
1,016
1,138
24.3
25.2
27.3
30.1
9.8
8.9
1.9
1.7
16.2
15.8
1.3
1.1
Ventures
TV Today Network
Buy
305
385
1,818
637
743
27.5
27.5
18.4
21.4
16.6
14.3
2.9
2.5
17.4
17.2
2.5
2.0
Metals & Mining
Coal India
Neutral
301
-
190,280
84,638
94,297
21.4
22.3
24.5
27.1
12.3
11.1
5.1
4.9
42.6
46.0
1.8
1.6
Hind. Zinc
Neutral
274
-
115,584
14,252
18,465
55.9
48.3
15.8
21.5
17.3
12.7
2.8
2.5
17.0
20.7
8.1
6.3
Hindalco
Neutral
180
-
37,263
107,899
112,095
7.4
8.2
9.2
13.0
19.6
13.9
0.9
0.9
4.8
6.6
0.9
0.8
JSW Steel
Neutral
1,616
-
39,056
53,201
58,779
16.1
16.2
130.6
153.7
12.4
10.5
1.7
1.5
14.0
14.4
1.5
1.3
NMDC
Neutral
120
-
37,888
6,643
7,284
44.4
47.7
7.1
7.7
16.9
15.6
1.5
1.4
8.8
9.2
3.5
3.1
SAIL
Neutral
49
-
20,196
47,528
53,738
(0.7)
2.1
(1.9)
2.6
18.8
0.5
0.5
(1.6)
3.9
1.3
1.2
Vedanta
Neutral
222
-
65,757
71,744
81,944
19.2
21.7
13.4
20.1
16.6
11.0
1.4
1.3
8.4
11.3
1.3
1.0
Tata Steel
Neutral
398
-
38,679
121,374
121,856
7.2
8.4
18.6
34.3
21.4
11.6
1.3
1.2
6.1
10.1
1.0
0.9
Oil & Gas
Cairn India
Neutral
245
-
45,869
9,127
10,632
4.3
20.6
8.8
11.7
27.8
20.9
0.9
0.9
3.3
4.2
6.5
5.4
GAIL
Neutral
403
-
51,158
56,220
65,198
9.3
10.1
27.1
33.3
14.9
12.1
1.4
1.3
9.3
10.7
1.1
0.9
ONGC
Neutral
278
-
237,714
137,222
152,563
15.0
21.8
19.5
24.1
14.3
11.5
1.2
1.2
8.5
10.1
2.0
1.8
Indian Oil Corp
Neutral
294
-
142,739
373,359
428,656
5.9
5.5
54.0
59.3
5.4
5.0
0.8
0.8
16.0
15.6
0.5
0.5
Reliance Industries
Neutral
991
-
321,213
301,963
358,039
12.1
12.6
87.7
101.7
11.3
9.7
1.2
1.1
10.7
11.3
1.5
1.3
Pharmaceuticals
Alembic Pharma
Neutral
649
-
12,228
3,483
4,083
20.2
21.4
24.3
30.4
26.7
21.3
6.1
4.9
25.5
25.3
3.4
2.9
Aurobindo Pharma
Buy
711
877
41,603
15,720
18,078
23.7
23.7
41.4
47.3
17.2
15.0
4.5
3.5
29.6
26.1
2.9
2.5
Aventis*
Neutral
4,209
-
9,693
2,277
2,597
17.3
18.3
149.4
172.0
28.2
24.5
4.7
3.8
25.1
28.8
3.9
3.2
Cadila Healthcare
Neutral
396
-
40,586
10,429
12,318
22.6
22.0
16.9
19.2
23.5
20.7
6.0
4.8
28.5
25.7
3.9
3.2
Cipla
Reduce
554
490
44,490
15,378
18,089
17.4
18.4
21.6
27.2
25.6
20.4
3.3
2.9
13.7
15.2
3.1
2.6
Stock Watch
November 25, 2016
Company Name
Reco
CMP
Target
Mkt Cap
Sales ( Čcr )
OPM(%)
EPS (Č)
PER(x)
P/BV(x)
RoE(%)
EV/Sales(x)
(Č)
Price ( Č)
( Č cr )
FY17E FY18E
FY17E
FY18E
FY17E
FY18E
FY17E
FY18E
FY17E
FY18E
FY17E
FY18E
FY17E
FY18E
Pharmaceuticals
Dr Reddy's
Neutral
3,107
-
51,490
16,043
18,119
20.8
22.4
112.4
142.9
27.7
21.8
3.7
3.2
14.1
15.9
3.2
2.8
Dishman Pharma
Neutral
240
-
3,869
1,718
1,890
22.7
22.8
9.5
11.3
25.2
21.2
2.4
2.2
10.1
10.9
2.7
2.4
GSK Pharma*
Neutral
2,652
-
22,466
3,000
3,312
15.4
20.6
46.5
60.8
57.0
43.6
13.7
13.6
26.3
30.6
7.2
6.6
Indoco Remedies
Reduce
275
240
2,536
1,112
1,289
16.2
18.2
11.6
16.0
23.7
17.2
3.8
3.2
17.0
20.1
2.4
2.0
Ipca labs
Accumulate
567
613
7,155
3,303
3,799
15.3
15.3
17.3
19.7
32.8
28.8
2.9
2.6
9.1
9.4
2.3
2.0
Lupin
Buy
1,460
1,809
65,836
15,912
18,644
26.4
26.7
58.1
69.3
25.1
21.1
4.9
4.0
21.4
20.9
4.2
3.5
Sun Pharma
Buy
684
847
164,522
31,129
35,258
32.0
32.9
30.2
35.3
22.6
19.4
3.7
3.0
20.0
20.1
4.9
4.1
Power
Tata Power
Neutral
69
-
18,770
36,916
39,557
17.4
27.1
5.1
6.3
13.6
11.0
1.2
1.1
9.0
10.3
1.5
1.4
NTPC
Neutral
157
-
129,289
86,605
95,545
17.5
20.8
11.8
13.4
13.3
11.7
1.4
1.3
10.5
11.1
2.8
2.8
Power Grid
Neutral
185
-
96,968
25,763
29,762
74.3
73.1
14.8
17.3
12.5
10.7
2.0
1.7
16.9
17.5
8.0
7.6
Real Estate
Prestige Estate
Buy
157
210
5,901
4,707
5,105
25.2
26.0
10.3
13.0
15.3
12.1
1.2
1.1
10.3
10.2
2.4
2.1
MLIFE
Buy
353
522
1,450
1,152
1,300
22.7
24.6
29.9
35.8
11.8
9.9
0.9
0.8
7.6
8.6
2.0
1.6
Telecom
Bharti Airtel
Neutral
302
-
120,522
105,086
114,808
34.5
34.7
12.2
16.4
24.7
18.4
1.7
1.6
6.8
8.4
2.1
1.8
Idea Cellular
Neutral
72
-
25,782
40,133
43,731
37.2
37.1
6.4
6.5
11.2
11.0
0.9
0.9
8.2
7.6
1.7
1.4
zOthers
Abbott India
Neutral
4,745
-
10,082
3,153
3,583
14.1
14.4
152.2
182.7
31.2
26.0
153.1
130.7
25.6
26.1
2.9
2.5
Asian Granito
Buy
186
351
559
1,071
1,182
12.1
12.4
12.7
16.0
14.6
11.6
1.4
1.2
9.5
10.7
0.8
0.7
Bajaj Electricals
Buy
215
274
2,169
4,801
5,351
5.7
6.2
10.4
13.7
20.6
15.7
2.5
2.3
12.4
14.5
0.4
0.4
Banco Products (India)
Neutral
173
-
1,238
1,353
1,471
12.3
12.4
14.5
16.3
11.9
10.6
16.5
14.9
14.5
14.6
0.9
91.3
Coffee Day Enterprises
Neutral
200
-
4,125
2,964
3,260
20.5
21.2
4.7
8.0
-
25.0
2.3
2.1
5.5
8.5
1.8
1.6
Ltd
Competent Automobiles Neutral
158
-
97
1,137
1,256
3.1
2.7
28.0
23.6
5.6
6.7
30.4
27.5
14.3
11.5
0.1
0.1
Elecon Engineering
Neutral
47
-
508
1,482
1,660
13.7
14.5
3.9
5.8
12.0
8.0
2.8
2.6
7.8
10.9
0.7
0.6
Finolex Cables
Neutral
387
-
5,923
2,883
3,115
12.0
12.1
14.2
18.6
27.3
20.8
14.5
12.7
15.8
14.6
1.7
1.6
Garware Wall Ropes
Neutral
611
-
1,336
873
938
14.3
14.3
35.2
37.5
17.4
16.3
3.0
2.6
17.5
15.9
1.4
1.3
Goodyear India*
Neutral
702
-
1,619
1,598
1,704
10.4
10.2
49.4
52.6
14.2
13.3
65.6
57.5
18.2
17.0
0.7
96.7
Hitachi
Neutral
1,336
-
3,634
2,081
2,433
8.8
8.9
33.4
39.9
40.0
33.5
32.3
26.9
22.1
21.4
1.7
1.5
HSIL
Neutral
299
-
2,161
2,384
2,515
15.8
16.3
15.3
19.4
19.5
15.4
19.4
16.7
7.8
9.3
1.1
1.0
Interglobe Aviation
Neutral
867
-
31,254
21,122
26,005
14.5
27.6
110.7
132.1
7.8
6.6
46.9
33.5
168.5
201.1
1.5
1.1
Jyothy Laboratories
Neutral
341
-
6,185
1,440
2,052
11.5
13.0
8.5
10.0
40.1
34.1
9.7
9.0
18.6
19.3
4.6
3.2
Kirloskar Engines India
Neutral
326
-
4,712
2,554
2,800
9.9
10.0
10.5
12.1
31.0
26.9
13.0
12.3
10.7
11.7
1.5
1.3
Ltd
Stock Watch
November 25, 2016
Company Name
Reco
CMP
Target
Mkt Cap
Sales ( Čcr )
OPM(%)
EPS (Č)
PER(x)
P/BV(x)
RoE(%)
EV/Sales(x)
(Č)
Price ( Č)
( Č cr )
FY17E
FY18E
FY17E
FY18E
FY17E
FY18E
FY17E
FY18E
FY17E
FY18E
FY17E
FY18E
FY17E
FY18E
zOthers
Linc Pen & Plastics
Neutral
232
-
342
382
420
9.3
9.5
13.5
15.7
17.2
14.7
2.9
2.5
17.1
17.3
1.0
0.9
M M Forgings
Neutral
420
-
507
546
608
20.4
20.7
41.3
48.7
10.2
8.6
57.6
51.0
16.6
17.0
0.8
0.7
Manpasand Bever.
Neutral
667
-
3,812
836
1,087
19.6
19.4
16.9
23.8
39.5
28.0
4.7
4.1
12.0
14.8
4.3
3.2
Mirza International
Buy
77
107
926
987
1,106
18.0
18.0
6.5
7.6
11.8
10.1
1.9
1.6
15.9
15.7
1.1
1.0
MT Educare
Neutral
117
-
466
366
417
17.7
18.2
9.4
10.8
12.5
10.8
2.8
2.4
22.2
22.3
1.2
1.0
Narayana Hrudaya
Neutral
345
-
7,060
1,873
2,166
11.5
11.7
2.6
4.0
130.6
87.1
8.0
7.2
6.1
8.3
3.9
3.3
Navkar Corporation
Buy
173
265
2,470
408
612
42.9
42.3
6.8
11.5
25.6
15.1
1.8
1.6
6.9
10.5
7.0
4.6
Navneet Education
Neutral
106
-
2,516
1,062
1,147
24.0
24.0
6.1
6.6
17.3
15.9
3.6
3.2
20.6
19.8
2.4
2.3
Nilkamal
Neutral
1,298
-
1,938
1,995
2,165
10.7
10.4
69.8
80.6
18.6
16.1
74.2
64.5
16.6
16.5
1.0
0.8
Page Industries
Neutral
12,506
-
13,948
2,450
3,124
20.1
17.6
299.0
310.0
41.8
40.3
278.5
212.6
47.1
87.5
5.7
4.5
Parag Milk Foods
Neutral
269
-
2,260
1,919
2,231
9.3
9.6
9.5
12.9
28.4
20.8
4.4
3.6
15.5
17.5
1.3
1.1
Quick Heal
Neutral
231
-
1,619
408
495
27.3
27.0
7.7
8.8
29.9
26.3
2.8
2.8
9.3
10.6
3.1
2.6
Radico Khaitan
Buy
117
147
1,562
1,667
1,824
13.0
13.2
6.7
8.2
17.7
14.3
1.6
1.5
9.0
10.2
1.3
1.2
Relaxo Footwears
Neutral
412
-
4,950
2,085
2,469
9.2
8.2
7.6
8.0
54.6
51.9
21.2
18.1
17.9
18.8
2.5
2.1
S H Kelkar & Co.
Neutral
288
-
4,165
1,036
1,160
15.1
15.0
6.1
7.2
47.2
40.1
5.0
4.6
10.7
11.5
3.9
3.4
Siyaram Silk Mills
Accumulate
1,189
1,605
1,115
1,733
1,948
11.6
11.7
96.6
114.7
12.3
10.4
1.9
1.6
15.3
15.7
0.8
0.8
Styrolution ABS India*
Neutral
584
-
1,026
1,440
1,537
9.2
9.0
40.6
42.6
14.4
13.7
36.7
33.4
12.3
11.6
0.7
0.6
Surya Roshni
Neutral
193
-
845
3,342
3,625
7.8
7.5
17.3
19.8
11.2
9.8
21.2
17.0
10.5
10.8
0.5
0.5
Team Lease Serv.
Neutral
834
-
1,426
3,229
4,001
1.5
1.8
22.8
32.8
36.6
25.4
3.9
3.4
10.7
13.4
0.3
0.3
The Byke Hospitality
Neutral
174
-
700
287
384
20.5
20.5
7.6
10.7
23.0
16.3
4.8
3.9
20.7
23.5
2.5
1.8
Transport Corporation of
Neutral
172
-
1,317
2,671
2,911
8.5
8.8
13.9
15.7
12.4
11.0
1.7
1.5
13.7
13.8
0.6
0.6
India
TVS Srichakra
Neutral
3,237
-
2,479
2,304
2,614
13.7
13.8
231.1
266.6
14.0
12.1
363.7
286.4
33.9
29.3
1.1
0.9
UFO Moviez
Neutral
435
-
1,199
619
685
33.2
33.4
30.0
34.9
14.5
12.5
2.0
1.7
13.8
13.9
1.6
1.3
Visaka Industries
Neutral
188
-
298
1,051
1,138
10.3
10.4
21.0
23.1
8.9
8.1
24.1
22.5
9.0
9.2
0.5
0.5
VRL Logistics
Neutral
261
-
2,386
1,902
2,119
16.7
16.6
14.6
16.8
18.0
15.5
3.9
3.5
21.9
22.2
1.4
1.2
Wonderla Holidays
Neutral
325
-
1,836
287
355
38.0
40.0
11.3
14.2
28.8
22.9
4.1
3.6
21.4
23.9
6.1
4.9
Source: Company, Angel Research; Note: *December year end; #September year end; &October year end; Price as on November 24, 2016
Market Outlook
November 25, 2016
Research Team Tel: 022 - 39357800
DISCLAIMER
Angel Broking Private Limited (hereinafter referred to as “Angel”) is a registered Member of National Stock Exchange of India
Limited,Bombay Stock Exchange Limited and Metropolitan Stock Exchange Limited. It is also registered as a Depository Participant with
CDSL and Portfolio Manager with SEBI. It also has registration with AMFI as a Mutual Fund Distributor. Angel Broking Private Limited is a
registered entity with SEBI for Research Analyst in terms of SEBI (Research Analyst) Regulations, 2014 vide registration number
INH000000164. Angel or its associates has not been debarred/ suspended by SEBI or any other regulatory authority for accessing
/dealing in securities Market. Angel or its associates/analyst has not received any compensation / managed or
co-managed public offering of securities of the company covered by Analyst during the past twelve months.
This document is solely for the personal information of the recipient, and must not be singularly used as the basis of any investment
decision. Nothing in this document should be construed as investment or financial advice. Each recipient of this document should make
such investigations as they deem necessary to arrive at an independent evaluation of an investment in the securities of the companies
referred to in this document (including the merits and risks involved), and should consult their own advisors to determine the merits and
risks of such an investment.
Reports based on technical and derivative analysis center on studying charts of a stock's price movement, outstanding positions and
trading volume, as opposed to focusing on a company's fundamentals and, as such, may not match with a report on a company's
fundamentals. Investors are advised to refer the Fundamental and Technical Research Reports available on our website to evaluate the
contrary view, if any.
The information in this document has been printed on the basis of publicly available information, internal data and other reliable
sources believed to be true, but we do not represent that it is accurate or complete and it should not be relied on as such, as this
document is for general guidance only. Angel Broking Pvt. Limited or any of its affiliates/ group companies shall not be in any way
responsible for any loss or damage that may arise to any person from any inadvertent error in the information contained in this report.
Angel Broking Pvt. Limited has not independently verified all the information contained within this document. Accordingly, we cannot
testify, nor make any representation or warranty, express or implied, to the accuracy, contents or data contained within this document.
While Angel Broking Pvt. Limited endeavors to update on a reasonable basis the information discussed in this material, there may be
regulatory, compliance, or other reasons that prevent us from doing so.
This document is being supplied to you solely for your information, and its contents, information or data may not be reproduced,
redistributed or passed on, directly or indirectly.
Neither Angel Broking Pvt. Limited, nor its directors, employees or affiliates shall be liable for any loss or damage that may arise from
or in connection with the use of this information.